Welcome to Shadowfax AI
The most advanced agentic analytics platform designed to supercharge analyst productivity
What is Shadowfax?
Shadowfax is an AI agent for data work. Simply describe your intent, collaborate with the agent on a plan, and watch it transform, analyze, visualize, and synthesize your data—transparently and intuitively. You get sophisticated analysis done in minutes, not days.
Shadowfax AI was designed to be accessible enough for beginners to use, yet powerful enough for expert analysts to build complex, interactive models and repeatable pipelines in a fraction of time it would typically take them.
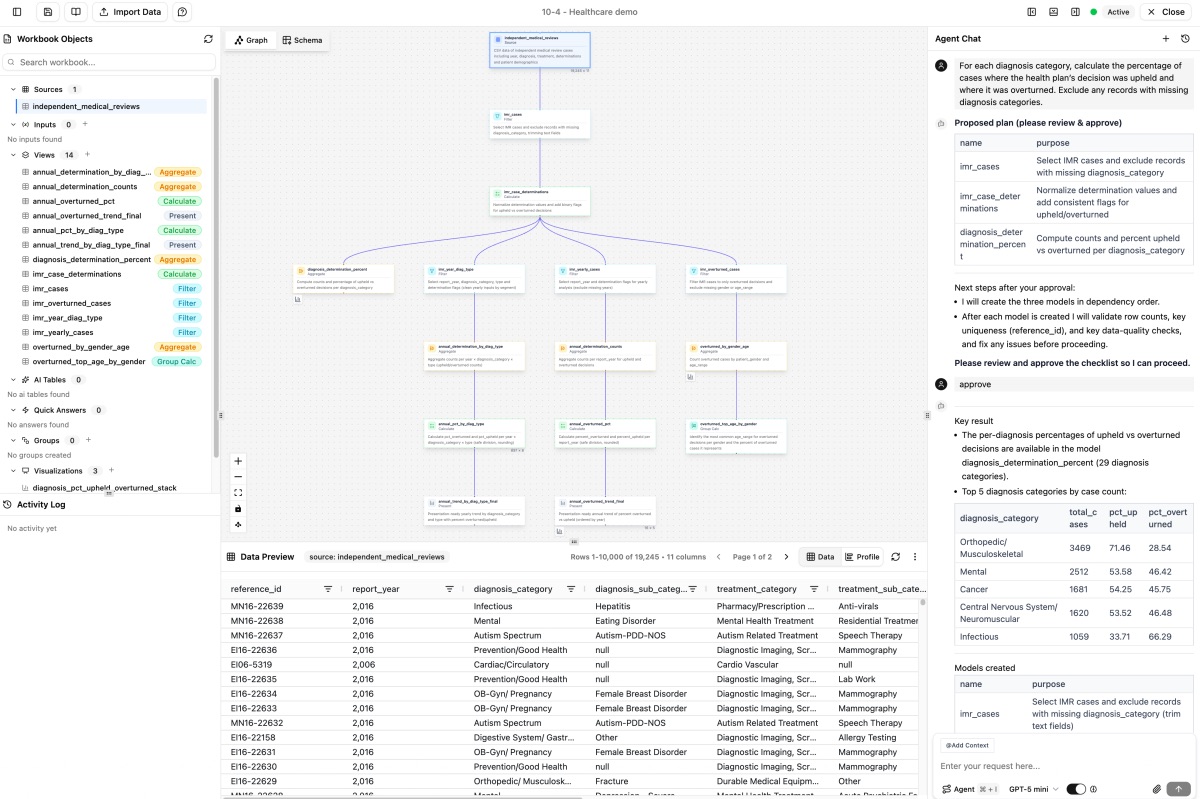
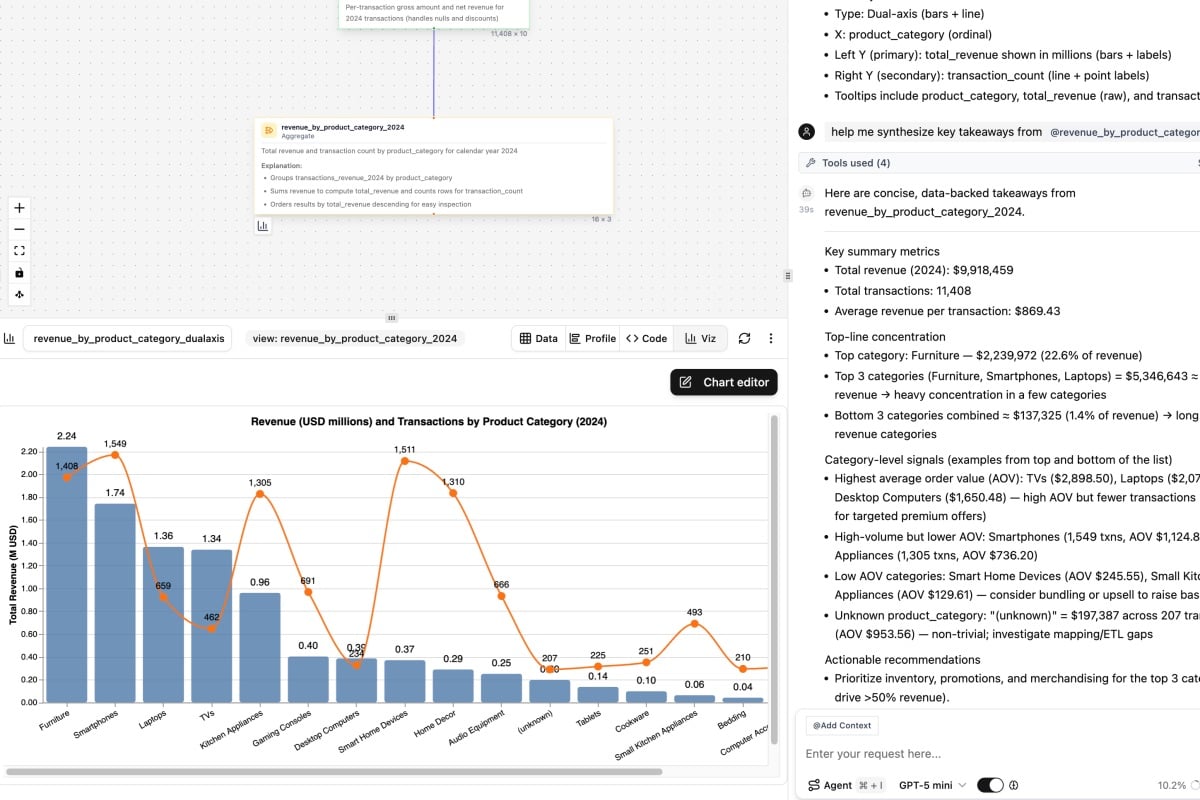
Chat with your AI analyst and watch as it builds Views, creates charts, and uncovers powerful insights hidden in your data
How It Works
Working with ShadowfaxAI is very similar to collaborating with a savvy, high performing analyst on your team with superhuman productivity levels.
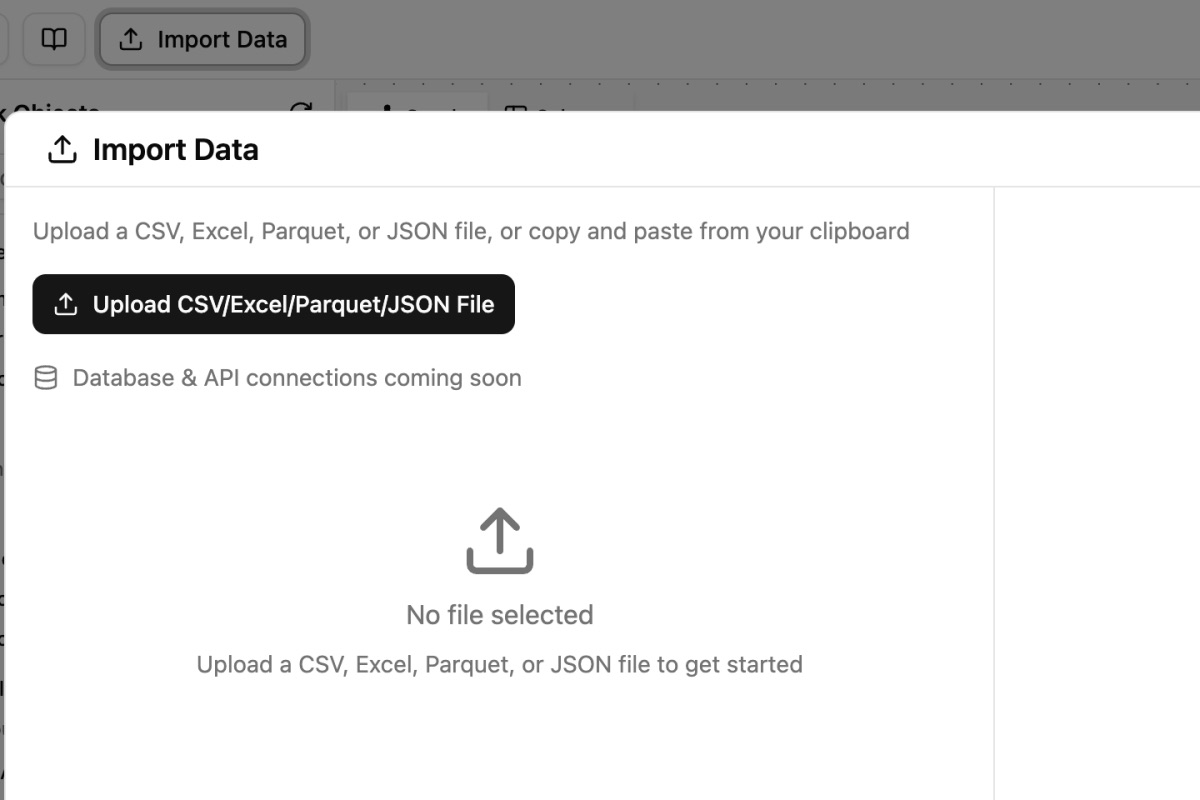
1. Connect to your data
You begin by creating a workbook and connecting to your data sources. As you upload them, you have the option of adding table or field level metadata context to capture the unique nuances present in your data.
In addition to data, you can also optionally enter 'workbook knowledge'. Think of this as a corporate or functional repository that describes metrics, business rules and definitions, stylistic patterns and other relevant context that you would share with a new team member. Workbook knowledge can be saved and reused across workbooks.
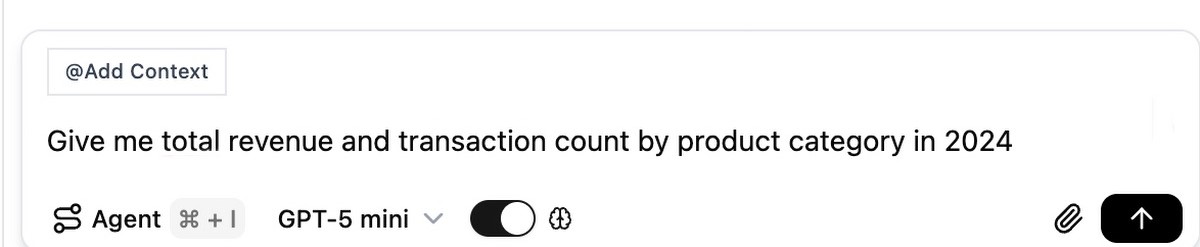
2. Describe your intent to the agent
Ask questions in plain English using @mentions to reference specific tables or fields.
Instructions can range from basic to advanced and can follow procedural or declarative patterns.
For example:
@[orders] Show monthly revenue trends and YoY growth rates for Q4 2024
or
segment customers into groups using their purchasing patterns in the most recent calendar year
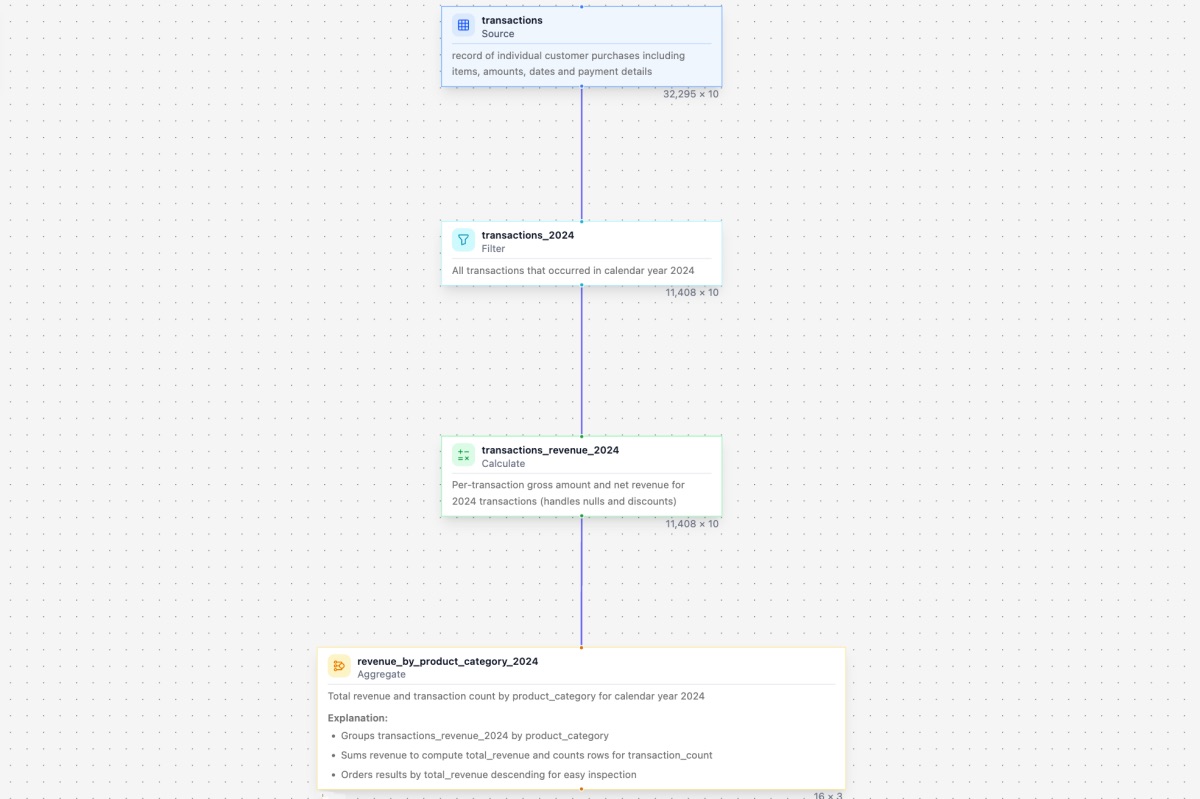
3. AI Creates Views
The agent breaks your task down into a series of discrete, single function, easy to verify views that are sequenced together and represented as a directed graph. All intermediate views and their outputs can be confidently validated by non-technical personas.
4. Get Insights Immediately
See your data in tables and charts along with a narrative explanation synthesizing key takeaways. Everything updates automatically when your source data changes.
5. Iterate and extend your analysis
Real world analytics is highly iterative where the answer to one question often raises several more. Want to dig deeper to diagnose the drivers behind the trends you see, specify variable inputs for scenario modeling and use sophisticated NLP techniques to analyze open-ended text? Shadowfax AI supports all of that and more. All interactions with the agent result in persistent objects displayed on the central analysis graph that can be verified, modified, organized and reproduced as needed
Understanding Your Workbook
When you work in Shadowfax, everything lives in a Workbook—your analytical workspace for a project. Here's what you'll find inside:
Sources Your original data (CSV uploads, database connections). These are immutable—Shadowfax never modifies your source data.
Views SQL transformations the AI creates for you. Each View is a step in your analysis pipeline. Click any View to see the SQL code and data preview.
AI Tables Special Views where AI adds intelligent columns—classifications, extractions, sentiment analysis, and more on a row-by-row basis. Perfect for tasks SQL can't handle.
Visualizations Charts and graphs powered by your Views. From simple bar charts to complex waterfalls, all created and finetuned through conversation.
The Reactive System Change your source data? All your Views update automatically. Fix an early transformation? Everything downstream recalculates. No broken formulas. No manual updates.
Who This Product Is For
- Data analysts who want to move faster without writing code or manually configuring widgets in no-code tools
- Business users tired of asking IT for data extracts to answer every question
- Teams that need self-service analytics
- Anyone who knows WHAT they want but not necessarily HOW to code it and cares deeply about correctness & verifiability
What You Can Do
With Shadowfax, you can:
Join, transform, prepare and clean messy data
Calculate custom metrics and KPIs with ease
Visualize your data and get a narrative style explanation for your burning questions
Dig deeper into diagnosing the drivers underpinning the trends you see
Build complex operational models with variables as scenario drivers with deep business context
Enrich your data with world knowledge or classify unstructured data into fixed taxonomies row-by-row with AI Tables
Collaborate with your team in shared Workbooks
Ready to dive in?
Explore the Getting Started guide with a quick 10 minute tutorial →
or choose one of the domain specific tutorials below
Domain specific tutorials
E-commerce & Sales Analytics
Learn product analysis, customer segmentation, and trend forecasting.
SaaS & Subscription Analytics
Master MRR tracking, cohort retention, and churn prediction.
Marketing & Campaign Analytics
Understand ROI measurement, funnel optimization, and attribution modeling.
Finance & Operations Analytics
Analyze budget variance, expense classification, and cash flow forecasting.
Need Help?
Browse our documentation using the sidebar
Check the FAQ for quick answers
Join our community (placeholder link)
Contact support at [email protected] (placeholder email)